Category: Technology Infographics
-

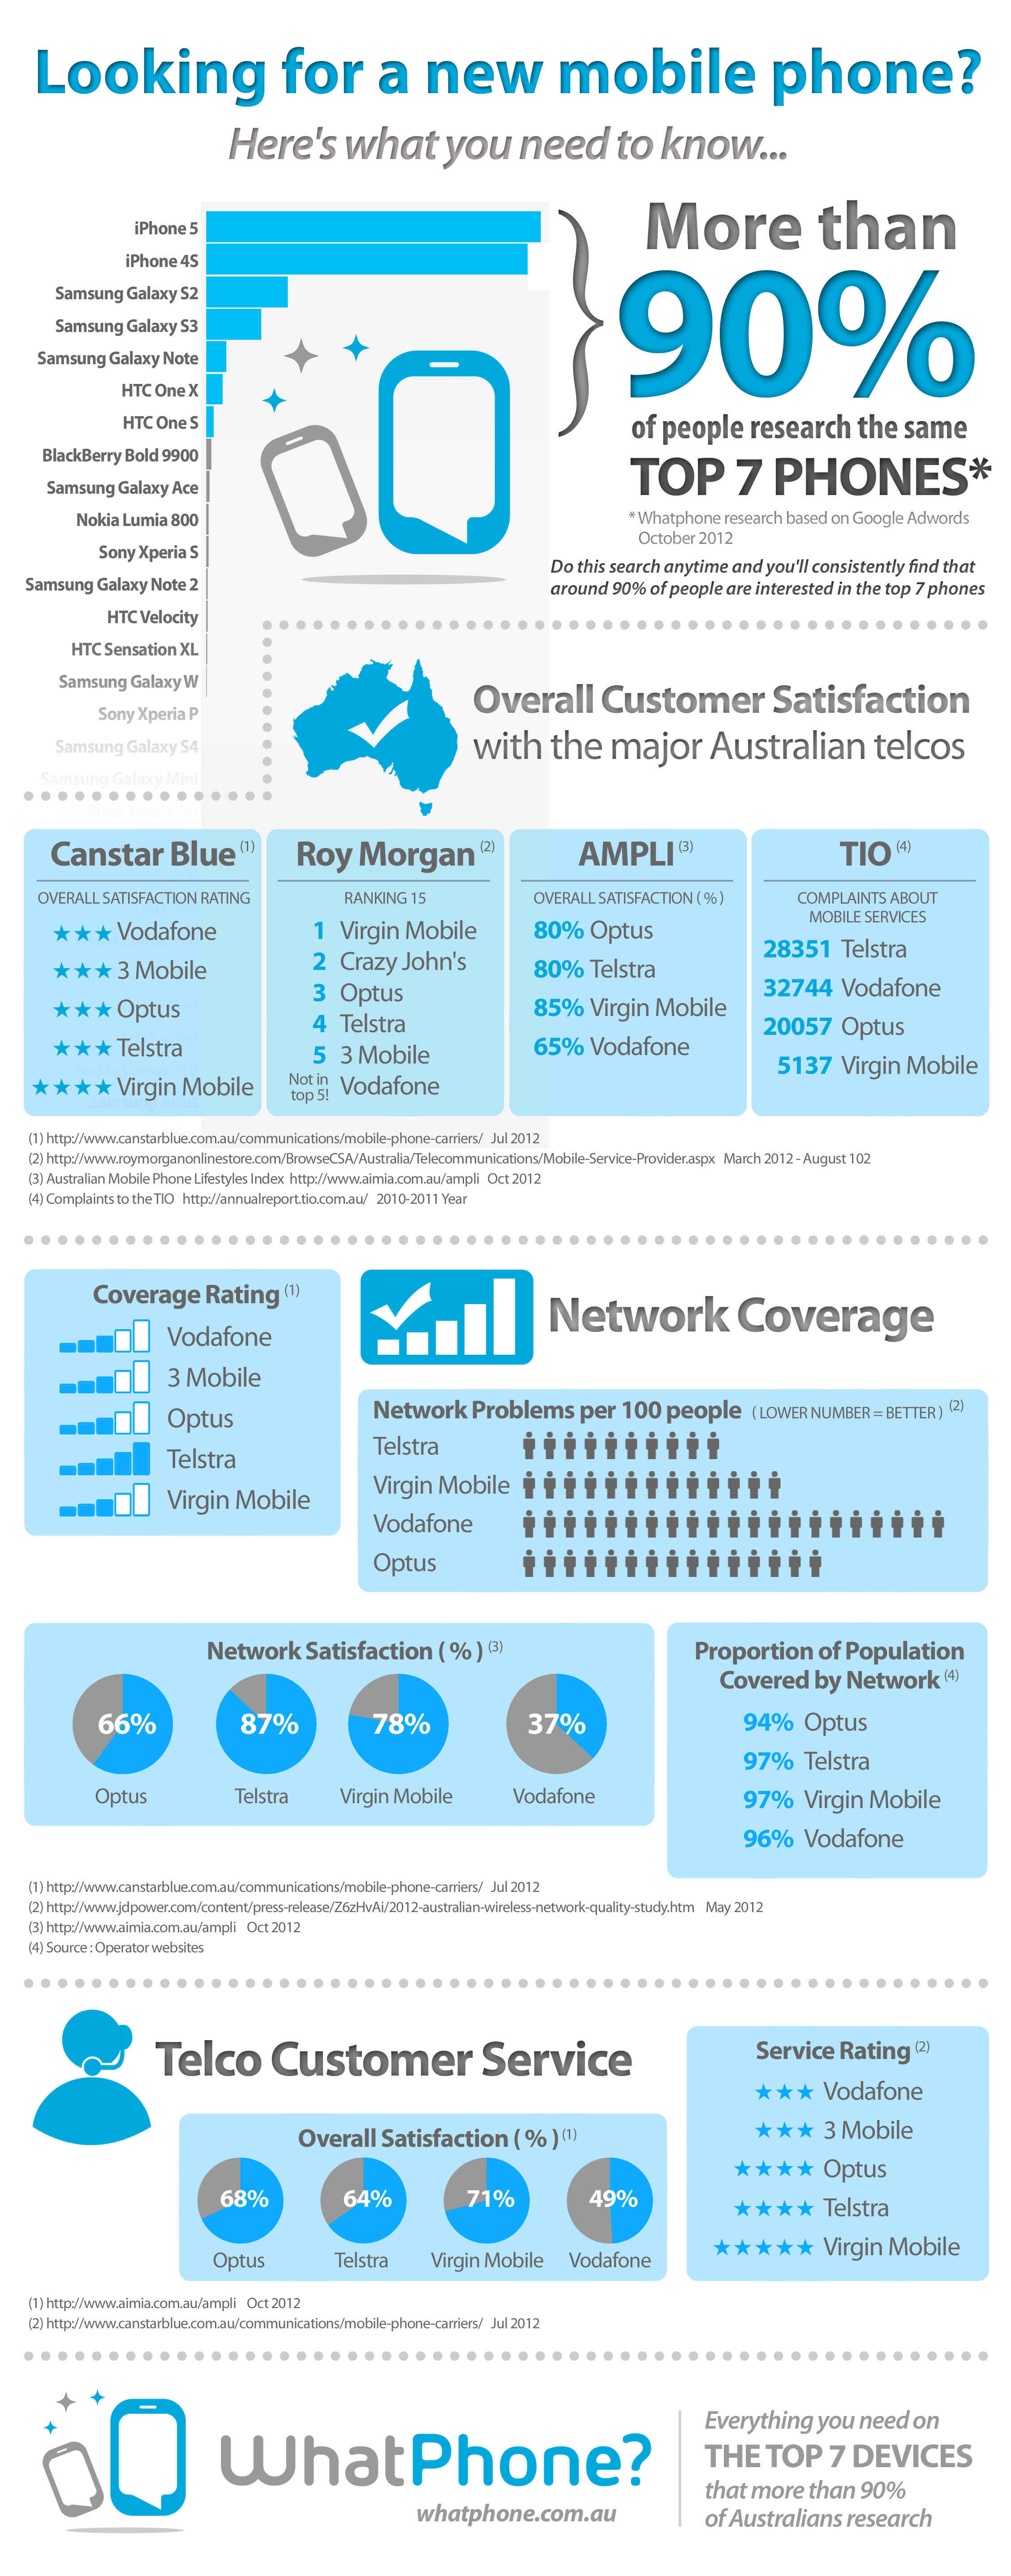
Looking For A new Mobile Phone ? Here’s What You Need To Know
People find it difficult to decide what mobile phone is right for them. The truth that no-one ever provides, however, is that it’s much easier than you think ! Consistently, more than 90% of people, research and buy the top 7 mobile phones. When you know which phone you want from that shortlist, the things…
-

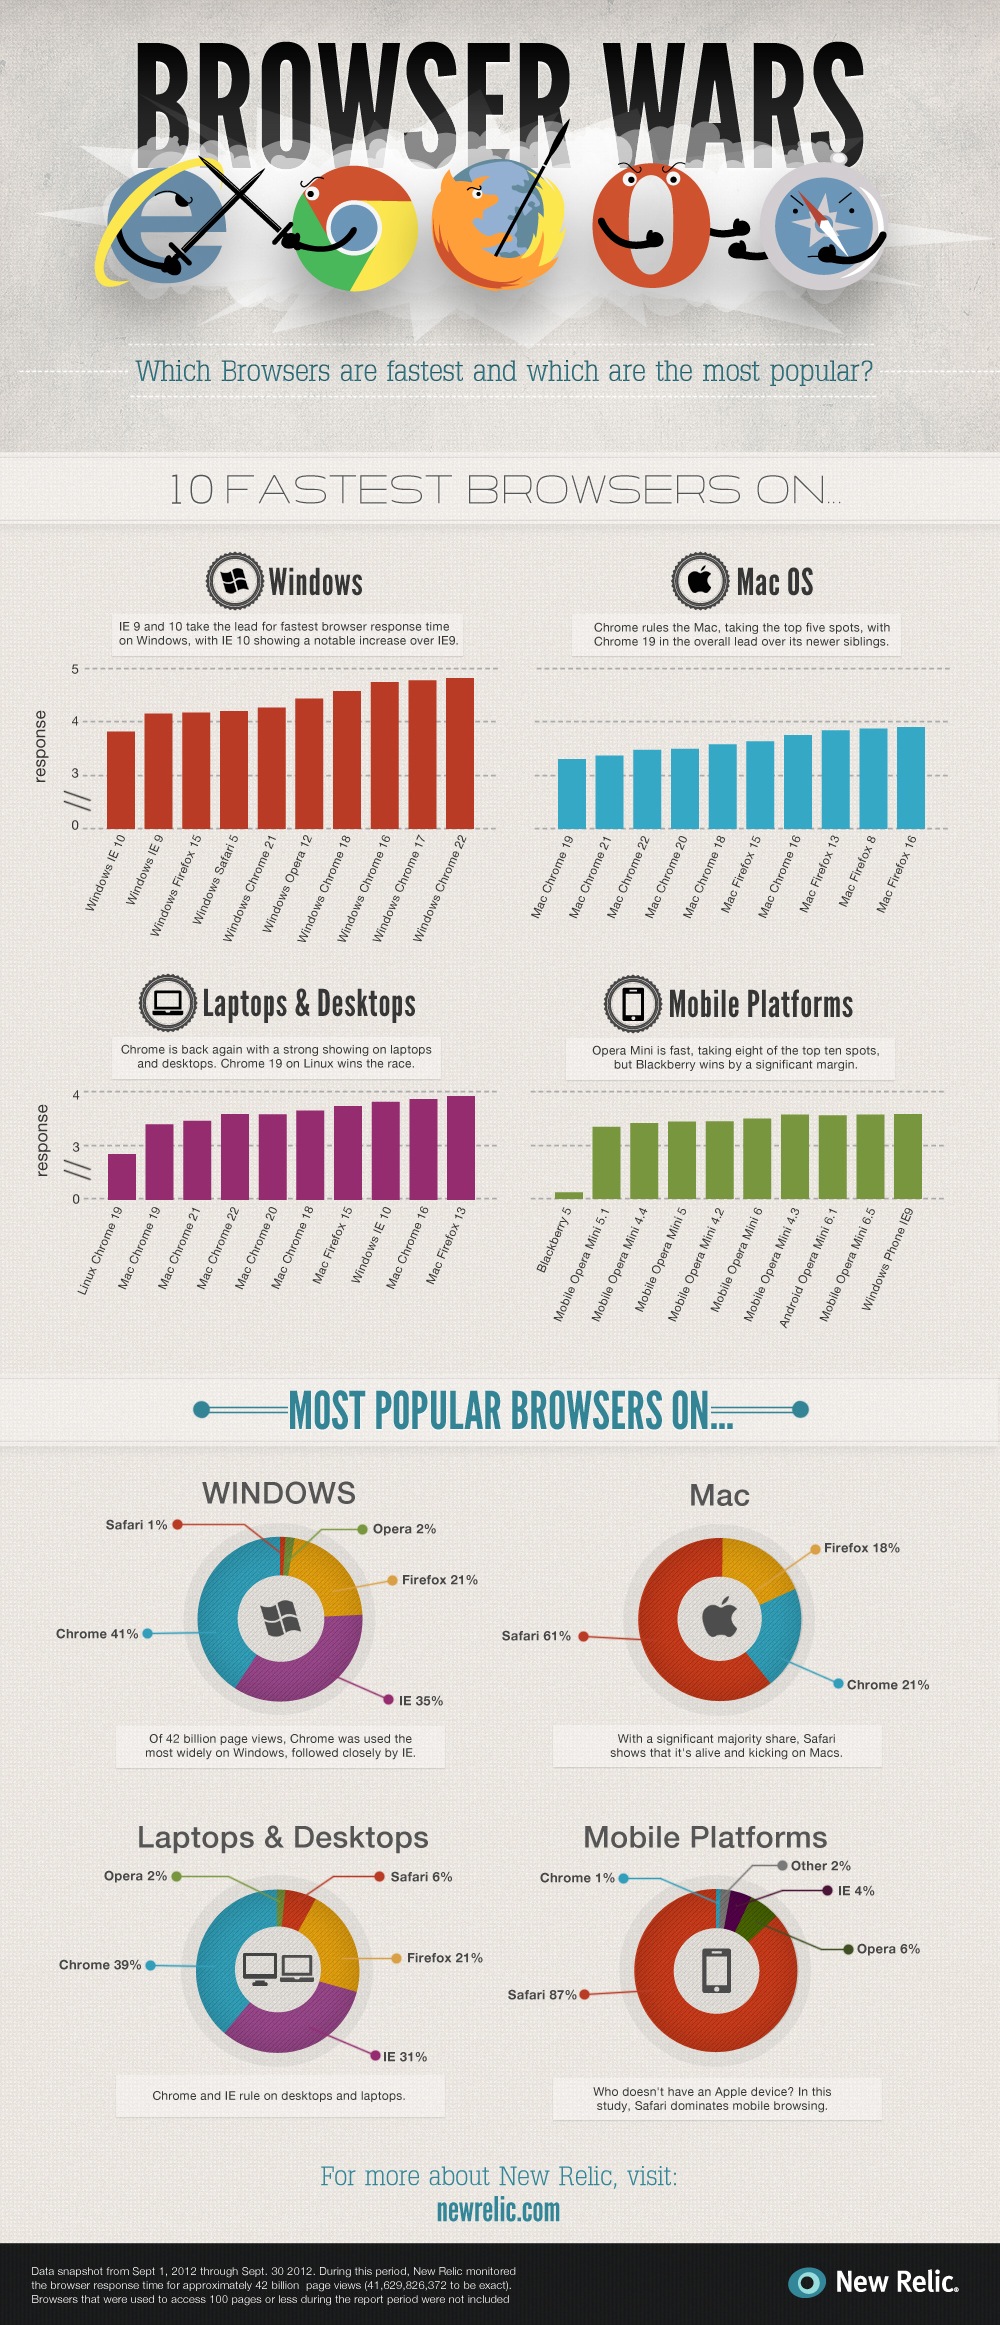
Browser Wars: Which Browsers Are the Fastest
It’s time for another installment of our “Browser Wars” blog series. Thanks to our Real User Monitoring (RUM) feature, we are able to periodically report on average browser speed experienced by the end users of the nearly 700,000 application instances monitored by New Relic. For the curious, New Relic monitors just over 1 million pageviews…
-

27 Most Important Google Search Algorithm Updates in 2012
Every year Google makes more than 500 changes to their algorithm. We gathered most important 27 updates in entire 2012 and have prepared an infographic for the same. You should have a look at it.
-

Smart Phone Users, By The Numbers
The infographic is about the percentage of Americans who are using smartphones and the age group that usually own these devices. This also shows how high is the number of people in the whole world prefers to use smartphones. In the U.S. alone, 25.6% aging 25-34 years old are using smartphones, 20.7% are aging 35-44.…
-

A Growing & Power Hungry Internet
While its cool to see how big the Internet is and how fast it’s growing, many people fail to think about what it takes to keep all of it up and running. After some research we found that it takes a whole heck of a lot of power and its not being used very efficiently.…
-

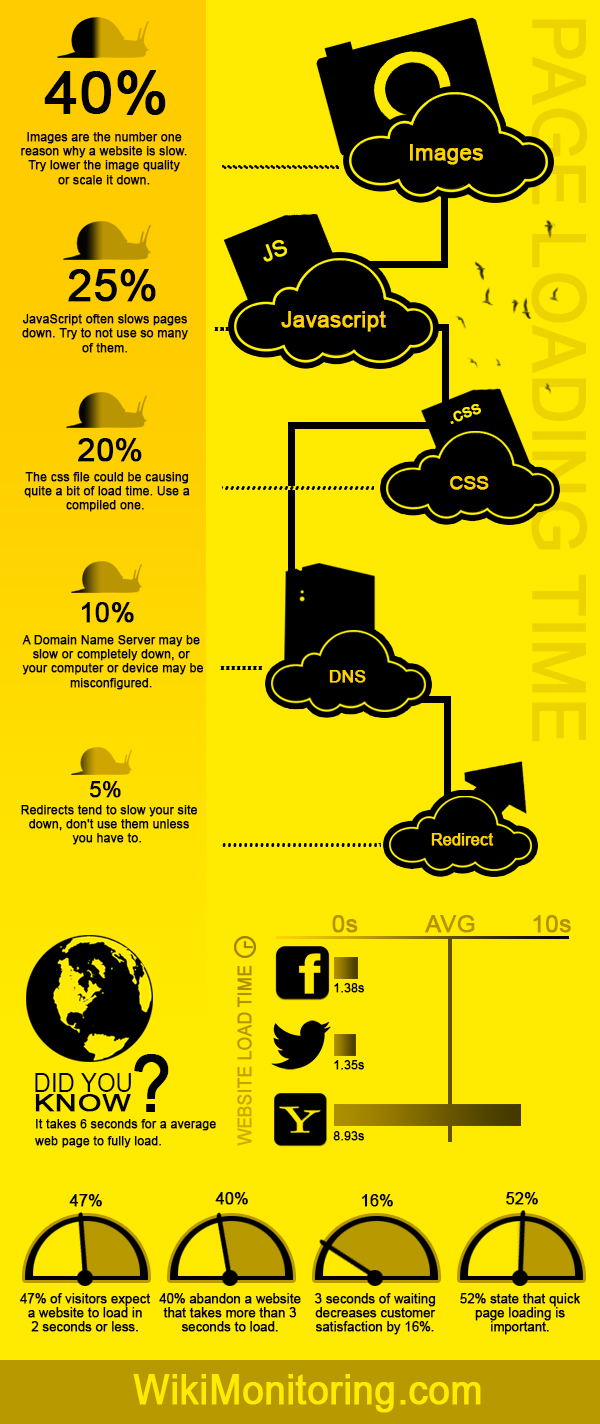
Website performance
This infographic explains why your website is so slow and how to fix it. We also show why it is importent with a quick page load.
-

Humanizing Big Data
Humanizing Big Data Infographic highlights the need to enable more employees with access to Big Data and the ability to analyze it in the context with other relevant data. These findings are based on a new global survey conducted by the Economist Intelligence Unit and Alteryx. Download additional high-resolution versions of the Infographic or a…
-

Is Photography Dead?
The first photograph was taken in 1826. We’ve come a long way since then! Check out this infographic to see the life of photography.
-

A Brief History of Watch Complications
This colorful and informative infographic tracks the development of timekeeping technology throughout the years, stretching from the ancient civilization that built the pyramids to the early 21st century. Discover the brilliant inventors who pushed the field of horology forward at each important juncture, and marvel at the degree of innovation and complication required each step…
-

Malware is Everywhere: Infographic on Security Awareness
Over the years, malware has become a serious problem for organizations and individuals alike. While most people assume only large businesses are targeted by malware attacks, it’s still a threat for small and medium size businesses, as well. Some of the statistics about the consequences of malware and hacking might surprise you. For instance, seeing…