Category: Entertainment Infographics
-

The Efficiency of Hooking Up via an App
How times have changed. Just a few short years ago, people were hesitant to admit that they’d met their mates online. Fast-forward to 2013, and now they’re boasting about finding love on their cell phones! Businesses of all stripes, spots, and avenues are rapidly seeing their online traffic migrate to mobile devices, and the industry…
-

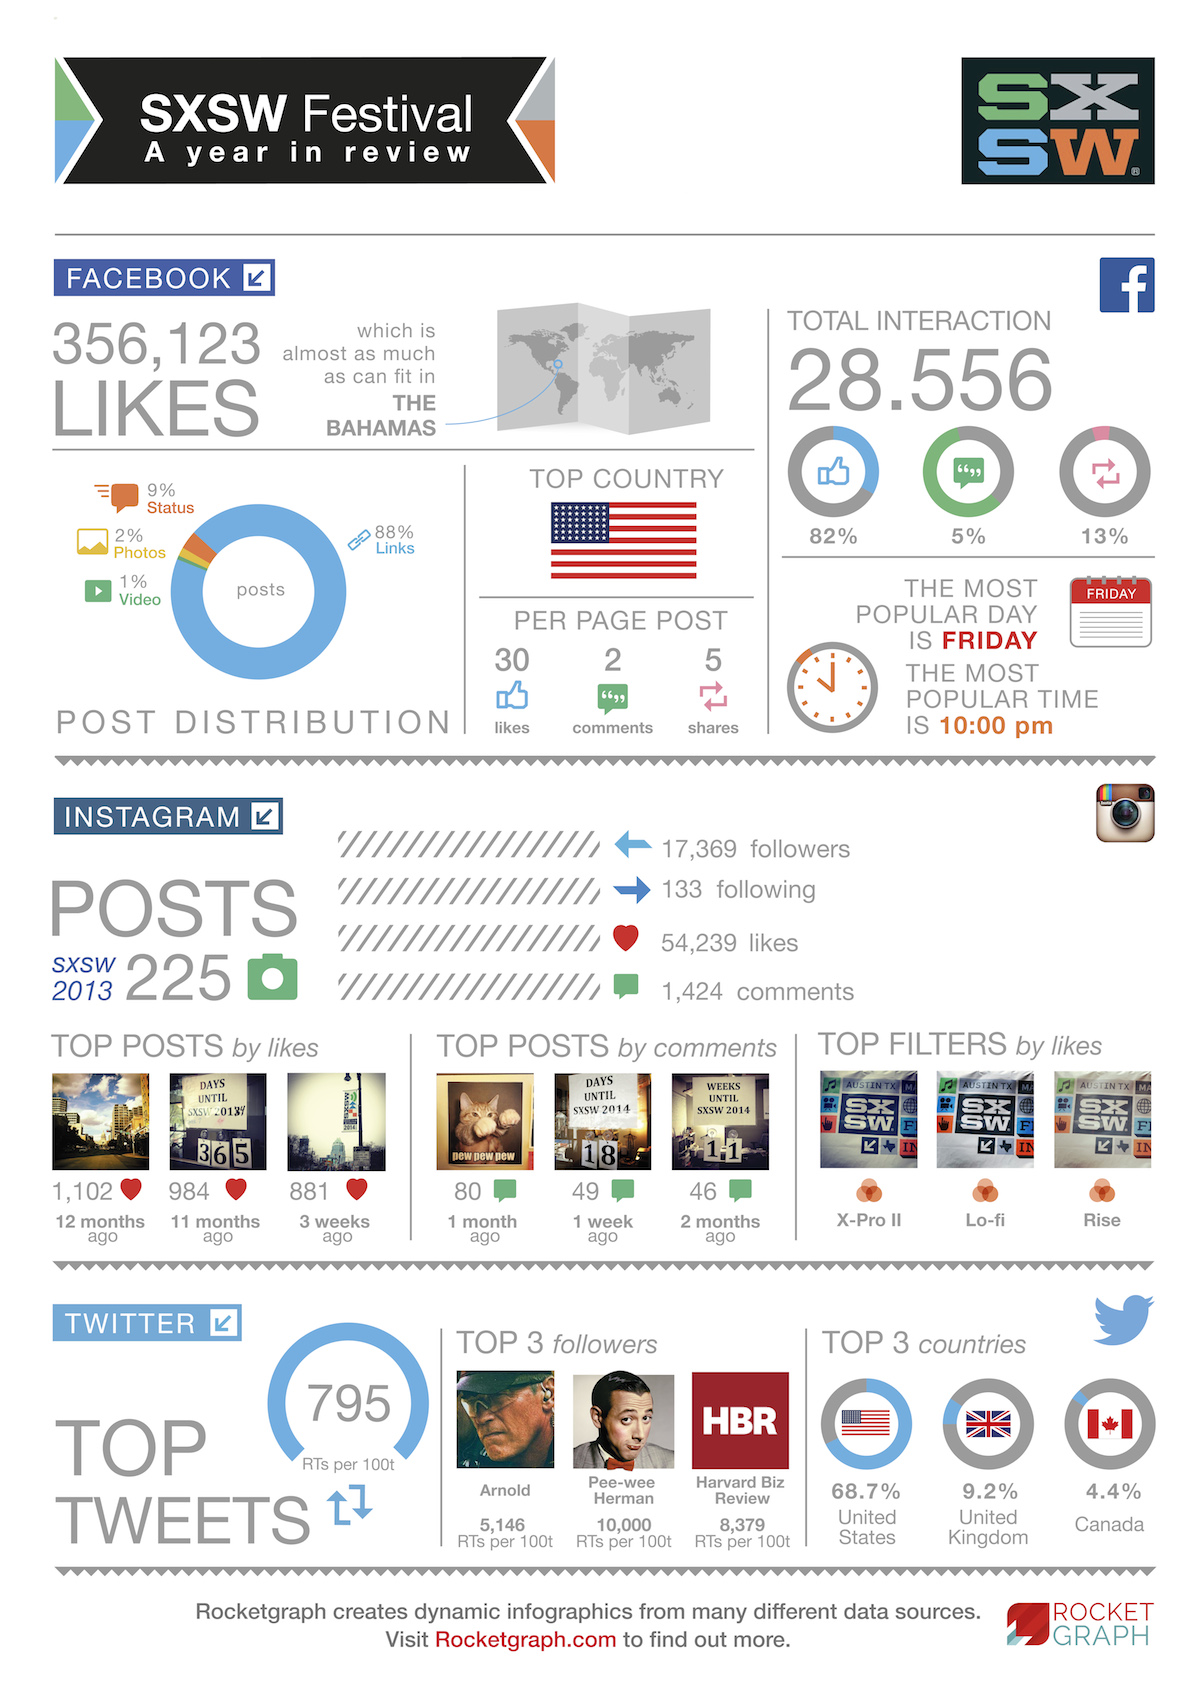
SXSW Festival: A year in review
This infographic was created with public information of the past 12 months from SXSW’s social media accounts. Rocketgraph is an online service that makes automatic infographics from various data sources. Sign up on rocketgraph.com if you want to be part of the beta user team.
-

Facts about couponing
Couponing is more popular than ever. Many people attempt to save money by collecting printed coupons or by searching the web for offers and digital coupons. So, to save you some time we’ve made this infographic with some interesting data and facts about couponing. You can also check out our Koopon App that lets you…
-

How Personality Traits Predict TV Habits
Americans LOVE television. According to Nielson, the average American spends 34 hours per week watching TV and over nine hours watching psychological traits, tv, habits commercials.While traditional demographics provide basic information about viewers, we wanted to understand what role psychological traits have in viewing habits of NBC shows. Our research team found that three personality…
-

The Evolution of the Zombie
Zombies have surpassed the barrier of fiction: they are part of our daily lives nowadays. But how did it all start?
-

Is a Zombie Invasion Possible?
Movies, games and books from the zombie world have made us immune to reality: today, we believe that an invasion of the undead is part of fiction. But this infographic is here to change your mind!
-

Sons of Anarchy infographic on motorcycle helmet laws by the badasshelmetstore.com
This shows the motorcycle helmet laws across the united states with a sons of anarchy theme.
-

Are Women Bad Drivers?
Are women actually bad drivers or is it just a stereotype? This infographic was done based on the research of the Michigan University and it gives us statistics on difference in driving between men and women. Who is more likely to crash? In which situations? What are the main characteristics and flaws of male and…
-

The Transformation of Black Friday
In 2013, about 141 million consumers hit the shops for deals over Thanksgiving weekend, with more of an emphasis on Thanksgiving Day shopping. What does this mean for Black Friday? This infographic by eBay Deals delves into how Black Friday has transformed from one day to an extended weekend event.
-

What will the top toys of Christmas 2013 be?
The numbers are in! One thing that’s always in demand at every Christmas is toys! 2013 has been no different and we’ve looked into what the hot favourites are this year in the toy department.